Projects
Each project includes the dataset, the question I was answering, and the business outcome — not just code.
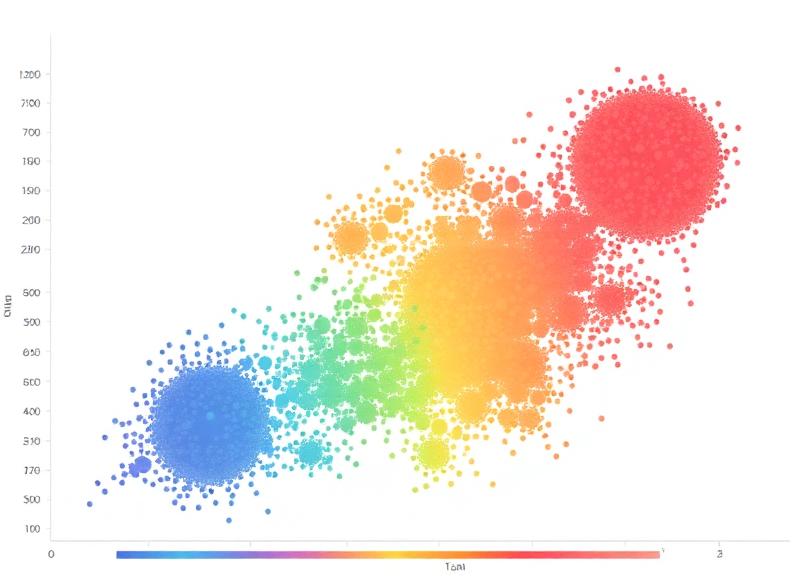
Customer Segmentation (RFM + K-Means)
Clustered 20K customers into 5 personas using RFM scoring and K-Means in Python.
Marketing used segments to target a campaign that lifted CTR by 22%.
Pythonscikit-learnMatplotlib
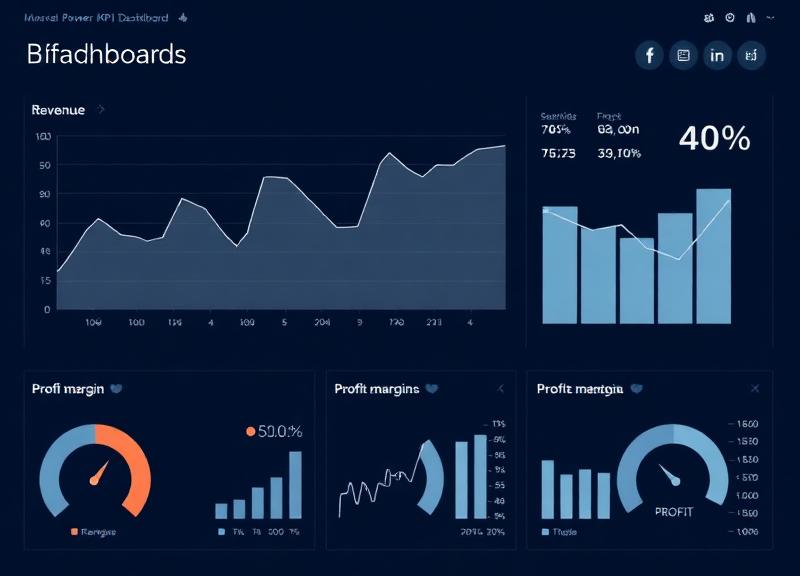
Financial KPI Report
Power BI report consolidating revenue, margin, and cash flow KPIs from 3 source systems.
Gave the finance team a single source of truth for monthly reviews.
Power BIExcelDAX